|
13.09.2024 11:34:12
|
AMINA Bank: Ethereum’s Evolving Value Proposition
The answer, at first glance, seems deceptively simple. Bitcoin's meteoric rise can be largely attributed to the watershed moment of spot Bitcoin ETF approvals in the United States. This development has opened the floodgates for institutional capital, propelling Bitcoin to new heights while leaving altcoins, including Ethereum, in its wake. Lets take a look at ETF flows thus far.
Figure 1: BTC and ETH ETF Flows

Source: AMINA Bank, Farside Investors
Interestingly, Ethereum's share of global ETP Assets Under Management (AUM) stands at a respectable 15.4% compared to Bitcoin. This figure aligns closely with Ethereum ETF inflows relative to Bitcoin ETF inflows (ex-Grayscale) over the first month, which sits at 19%. These statistics suggest that:
Ethereum maintains its proportional appeal among institutional investors, despite its apparent underperformance in the broader market.
Market Dynamics
While ETH has underperformed (YTD +4%) relative to BTC's impressive 35% year-to-date increase, it's important to note that not all altcoins have shared this fate. Several cryptocurrencies within the top 70 by market cap have outshone even Bitcoin's stellar performance:
1. BNB: 66% (31% above BTC)
2. TON: 124% (89% above BTC)
3. FET: 87% (52% above BTC)
4. PEPE: 478% (443% above BTC)
5. WIF: 1018% (983% above BTC)
This divergence in performance highlights the current market's preference for emerging L1 blockchains (like TON), AI projects (FET), and memecoins (PEPE and WIF). It also underscores the current narrative and interests of users.
The Layer 2 Roadmap: A Double-Edged Sword
Coming back to Ethereum, its journey towards scalability has led to the rise of Layer 2 (L2) networks such as Arbitrum, Optimism, Base, Blast, and zkSync. This shift has dramatically reduced gas fees for users and improved transaction speeds, addressing long-standing criticisms of the Ethereum network. However, this solution has introduced new complexities to Ethereum's value proposition.
The numbers tell a compelling story. The top 12 L2 solutions now process a staggering five times more daily active addresses and transactions than Ethereum's mainnet. This migration of activity off the base layer has had profound implications for Ethereum's economic model.
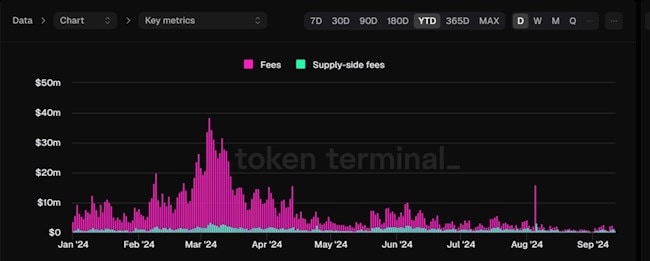
The recent Cancun/Deneb upgrade, implemented on March 13, 2024, has further amplified this effect. By reducing fees for rollup operators by a factor of 1000, the upgrade has significantly diminished Ethereum's fee-derived protocol revenue in the short term.
Figure 2: Fees (paid by users) and Supply Side Fees (share of transaction fees earned by validators)
Source: AMINA Bank, TokenTerminal
While this move enhances Ethereum's scalability, it has also contributed to ETH's underperformance, especially as L2 solutions become increasingly interoperable with other high-performance, low-cost settlement and data availability chains like Celestia.
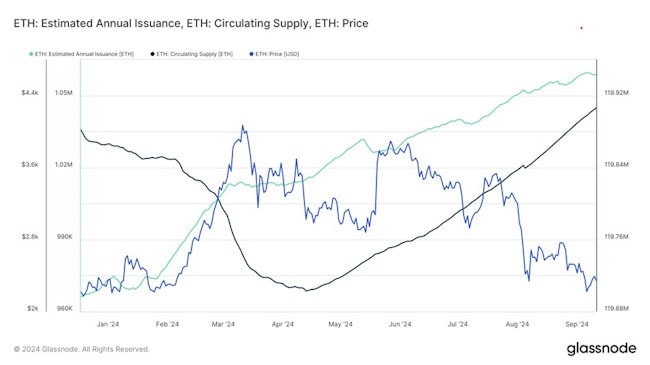
Reduced fees for Ethereum have also led to supply-side factors affecting Eth’s performance. After the Cancun upgrade in March, fees on Ethereum reached an all-time low. This has resulted in a net issuance in ETH supply, and the total circulating supply is now net positive. The increase in supply is an evident factor in ETH's dismal performance as well.
Figure 3: ETH: Estimated Annual Issuance, ETH: Circulating supply, ETH: Price
Source: AMINA Bank, Glassnode
The Shifting Sands of DeFi and NFTs
The DeFi landscape has shifted significantly, with investor focus moving towards emerging narratives like ETFs, memecoins, and artificial intelligence projects. This change has potentially slowed the influx of fresh capital into ETH. While Ethereum still hosts more than half of all DeFi investments, the challenge lies not in the absolute value locked in these protocols, but in the waning engagement levels and the diversion of attention to newer opportunities in other ecosystems.
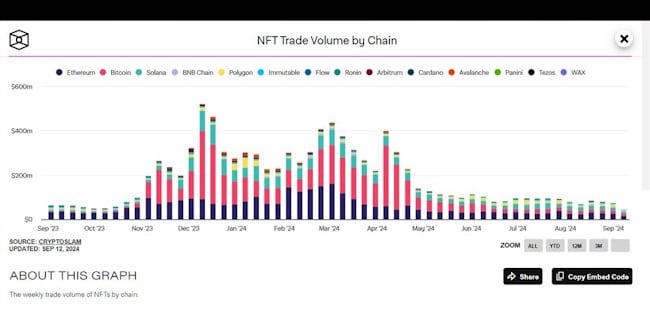
Even NFT markets, another significant driver of Ethereum activity, have seen a sharp decline in activity and volume.
Figure 4: NFT Trading Volumes by Chain
Source: AMINA Bank, The Block
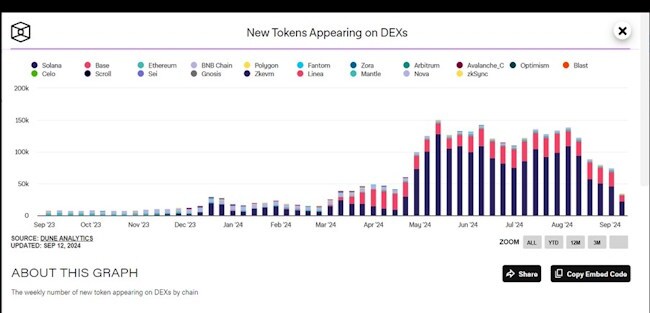
The landscape of token launches has also evolved; while most new tokens were launched on BNB and Ethereum a year ago, the trend has now shifted towards platforms like Solana and Base. Consequently, the demand for ETH as a trading pair for these new tokens has diminished, further impacting its utility and potentially its value proposition.
Figure 5: New Tokens Appearing on Dexes Per Chain
Source: AMINA Bank, The Block
Utility and Demand
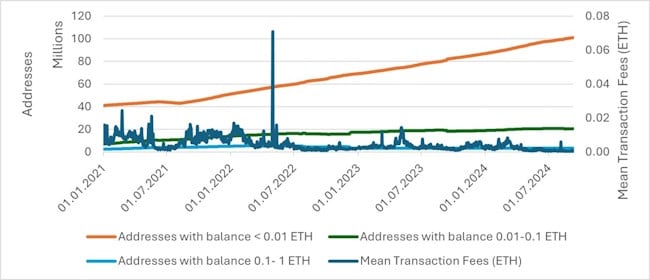
The reduced gas fees resulting from L2 adoption have decreased the need for users to hold large amounts of ETH for transaction purposes. This change in user behavior may have contributed to a reduction in buying pressure on ETH. An analysis of address cohorts and mean transaction fees supports this theory, showing a decrease in both the average transaction fee on Ethereum and the patterns of ETH holders. There is a significant increase in accounts holding less than 0.01 ETH and a flat line in accounts holding 0.1-1 ETH, which earlier could be accounted for tokens meant for gas usage.
Figure 6: Ethereum address Cohorts and Transaction Fees
Source: AMINA Bank, Glassnode
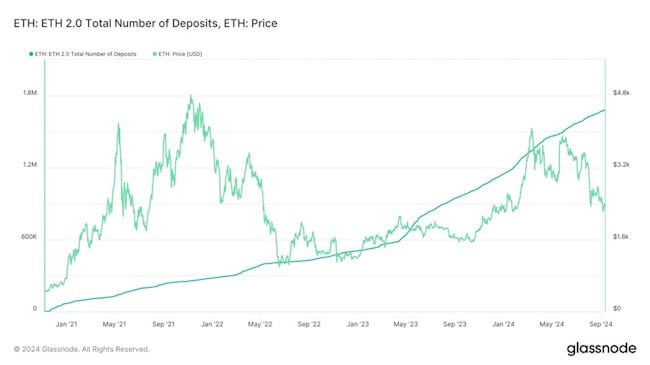
However, the demand for staking and restaking continues to grow. With more than 50 billion USD worth of ETH staked in staking contract and 10 billion in restaking protocols, the demand to earn yield on Ethereum stays. Lido, one of the biggest liquid staking providers on Ethereum consistently posts highest revenues among defi projects.
But does demand for staking equate to price appreciation? It does in the sense of increased demand to earn yields, but it has a more gradual and slow effect on price rather than a sudden one, which is also evident from the graph below.
Figure 7: Total Number of Ethereum Staked
Source: AMINA Bank, Glassnode
Mean Reversion
Despite the challenges, a technical analysis of the ETH/BTC ratio offers a potential silver lining for Ethereum investors. An Augmented Dickey-Fuller test reveals that the ETH/BTC ratio exhibits mean-reverting behavior over periods up to 90 days, with a half-life of 46 days.
Given the current ratio of 0.040 and a long run mean of 0.06, this analysis suggests a potential 25% increase in the ETH/BTC ratio within the next 46 days. At Bitcoin's current price of $58,000, this projection implies an Ethereum price target of $2,927, representing a 25% increase in six weeks.
While this short-term projection offers some optimism, it's essential to approach such forecasts with caution, given the inherent volatility and unpredictability of the space.
The Long Game: Ethereum's Evolving Value Proposition
As we look beyond immediate market movements, Ethereum's value proposition continues to evolve. The blockchain modularity thesis posits that Layer 2 rollup service providers, rather than end-users, will become the primary drivers of network fees for Layer 1 blockchains like Ethereum.
This shift, coupled with the growing adoption of account abstraction on L2s, suggests that rollup operators may become the primary holders of ETH for block space payments. While this change may impact ETH's traditional utility, it opens up new avenues for value accrual within the Ethereum ecosystem.
Moreover, the emergence of liquid staking solutions and the maturation of re-staking protocols present new opportunities for ETH holders. These developments could lead to a scenario where end-users and DeFi protocols primarily hold token representations of staked ETH and its accumulating yield, rather than the native ETH token itself.
Conclusion
The numbers don't lie, and the common perception that Layer 2 solutions have driven value away from Ethereum is playing out before our eyes. Transaction activity on L2s has surpassed Ethereum's mainnet, and reduced fees on L2s have diminished Ethereum's revenue streams. This shift has undeniably impacted ETH's performance relative to other cryptocurrencies, particularly Bitcoin.
Yet, Ethereum continues to capture its share of institutional interest, evidenced by its proportional representation in global ETPs and ETF inflows. Ethereum's established network effects and robust developer ecosystem remain significant advantages. While L2s have currently dimmed Ethereum's spotlight, the network's fundamental strengths and its pivotal role in the broader blockchain ecosystem position it for future growth.
Disclaimer
This document is provided by AMINA Bank AG ("AMINA") and is intended for educational and informational purposes. AMINA’s weekly Crypto Market Monitor is not intended for distribution in any jurisdiction where such distribution would be prohibited. Furthermore, it is not aimed at any person or entity residing in such jurisdiction. It does not constitute an offer or a recommendation to subscribe, purchase, sell or hold any security or financial instrument. The document contains the opinions of AMINA as at the date of issue, which do not take into account an individual’s circumstances and objectives. AMINA does not make any representation that any investment or strategy is suitable or appropriate to individual circumstances or that any investment or strategy constitutes personalized investment advice. Some investment products and services may be subject to legal and regulatory restrictions or may not be available worldwide on an unrestricted basis. The information and analysis contained in this Crypto Market Monitor are based on sources considered as reliable. AMINA makes its best efforts to ensure the timeliness, accuracy, and comprehensiveness of the information contained in this document. Nevertheless, all information indicated herein may change without prior notice.
BITCOIN KAUFEN? DAS SOLLTEN SIE JETZT WISSEN!
Was beim Einstieg wirklich zählt: Sichere Handelsplätze finden, wichtige Grundlagen und aktuelle Trends verstehen.
Jetzt informieren und fundiert in Bitcoin investierenTop Kryptowährungen
| Bitcoin | 68’826.24364 | -0.67% | Handeln |
| Vision | 0.06503 | 3.41% | Handeln |
| Ethereum | 2’318.18552 | -0.33% | Handeln |
| Ripple | 1.46061 | -0.71% | Handeln |
| Solana | 97.29769 | -1.51% | Handeln |
| Cardano | 0.27980 | -3.67% | Handeln |
| Polkadot | 1.44601 | -0.79% | Handeln |
| Chainlink | 9.73355 | -1.09% | Handeln |
| Pepe | 0.00000 | -2.16% | Handeln |
| Bonk | 0.00001 | -2.66% | Handeln |
Inside Krypto
Ob Industrie 4.0, Luxusgüter oder Internet-Infrastruktur - hier finden Sie aktuelle Anlagetrends mit vielen Hintergrundinformationen und passenden Trendaktien. Jetzt mehr lesen
Krypto-Crash oder Einstiegs-Chance? – Bernhard Wenger von 21Shares zu Gast im BX Morningcall
Im BX Morningcall spricht Krypto-Experte Bernhard Wenger von @21shares über seinen Weg vom klassischen ETF-Geschäft in die Welt der Krypto-ETPs und erklärt, warum Bitcoin & Co. längst nicht ausgereizt sind. Er beleuchtet den Wandel von einem vorwiegend retailgetriebenen Markt hin zu immer mehr institutionellen Investoren, die über regulierte, physisch besicherte Produkte wie Bitcoin- und Krypto-ETPs investieren. Themen sind unter anderem Volatilität und „Krypto-Winter“, strenge Compliance- und Geldwäschereiregeln, Kostenstrukturen, Unterschiede im DACH-Raum sowie die Rolle des neuen US-Bitcoin-ETFs und des strategischen Investors FalconX für die nächste Wachstumsphase von 21Shares.
👉🏽 https://bxplus.ch/bx-musterportfolio/


